Definition

What is Blue Energy?

In Indian official usage, “blue energy” means the suite of ocean and marine renewable energy resources inventoried by INCOIS across India’s Exclusive Economic Zone. It is not the same as blue hydrogen, the Blue Economy framework or the truck maker Blue Energy Motors. This page sets out the working definition, the technologies included, and how it overlaps with — but is separate from — those other uses of the same word.

Definition Ocean renewable INCOIS Distinctions
How to read every ocean energy number on this site. Every statistic in Indian blue-energy publications — the 9.2 lakh TWh headline, every per-form estimate, every international comparison — is presented at four levels: resource potential (the gross energy physically present in a sea cell), extractable potential (what a real device can capture at realistic efficiency), techno-economic potential (what is plausibly deployable at plausible cost with grid access) and project feasibility (what survives site-specific engineering, environmental and social screening). The largest number is always the resource potential and is almost never what gets built. For any deployment-relevant figure, look at the techno-economic line.

The short answer

Blue energy in the Indian context is ocean and marine renewable energy — the power we can obtain from the ocean without burning fuel. It includes wave energy, tidal energy (both barrage and stream), ocean current energy, Ocean Thermal Energy Conversion (OTEC) and Low-Temperature Thermal Desalination (LTTD), salinity-gradient or osmotic power, offshore wind, and offshore / floating solar. The Indian National Centre for Ocean Information Services (INCOIS) — under the Ministry of Earth Sciences — is the nodal agency that produces the Integrated Ocean Energy Atlas, which inventories the country’s combined theoretical potential for these forms of energy.

This integrated view is the distinctive thing about India’s recent communications: rather than treat each ocean-renewable form separately, INCOIS combines wave, tidal, current, OTEC and offshore wind onto a single 5 km grid so that planners can see which coast is best for which technology, and where a hybrid device might be sensible.

The phrase has several meanings — be careful

“Blue energy” sounds like an unambiguous technical term, but a reader quickly finds three or four different uses of the same English phrase. A 2023 peer-reviewed review by Indian researchers even opens by noting that “the term blue energy is used in the literature in at least three different ways”. On this site we use the INCOIS definition consistently, and outline the alternative meanings so you can quickly move to the right source.

Senses of “blue energy” and where they live
SenseWhat it coversWhere the term is used
India — official, dominantOcean & marine renewables — wave, tidal, OTEC, currents, salinity gradient, offshore wind, floating solarINCOIS Integrated Ocean Energy Atlas (2024), MoES communications, Draft National Marine & Ocean Energy Policy discourse
Global — narrower technicalSalinity-gradient / osmotic power (PRO, RED)Early academic literature, ISO/IEC standardisation of “blue energy” terminology
Hydrogen policyBlue hydrogen — natural gas + carbon captureHydrogen Mission documents (where it appears alongside green, pink, white hydrogen)
General economyBlue economy — sustainable ocean economy frameworkMinistry of Earth Sciences Blue Economy documents, UN, World Bank
BrandBlue Energy Motors — LNG and EV truck manufacturerTrade press, company filings

If you arrived here from a hydrogen-policy or blue-economy document, see resources for authoritative pointers to those literatures. This site is exclusively about senses ① and ②.
What’s included

The seven forms India’s “blue energy” covers

Different forms of ocean and marine renewable energy draw on different physical mechanisms. The INCOIS Integrated Ocean Energy Atlas inventories seven — and combines them so a planner looking at any kilometre of coastline can see which forms are jointly available and which are mutually exclusive (wave energy reduces in calm seas, OTEC requires a temperature gradient deeper than 800 m).

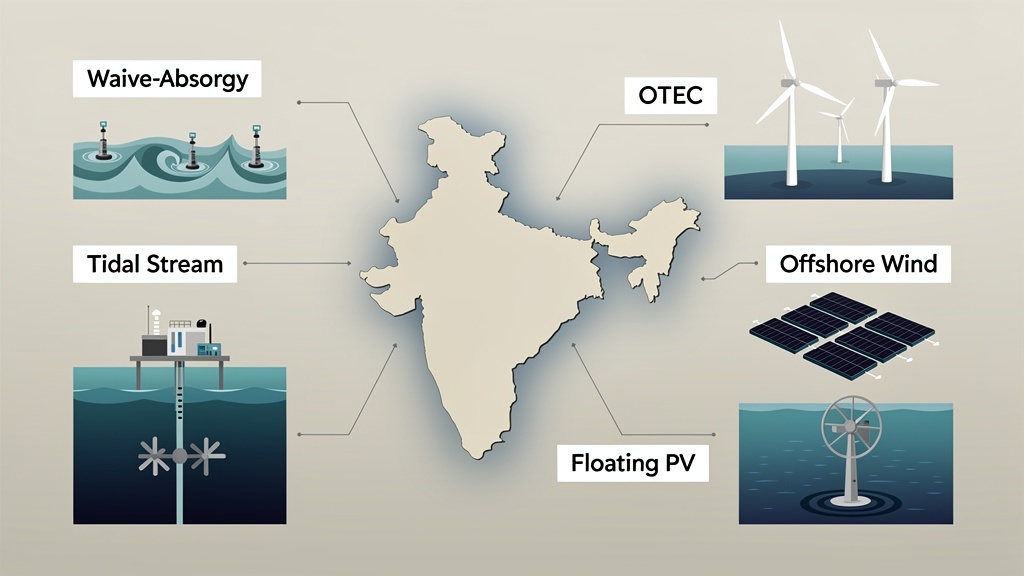
Six ocean energy technologies arranged circularly around a stylised Indian coastline.
Concept overview — different forms require different conditions at sea.
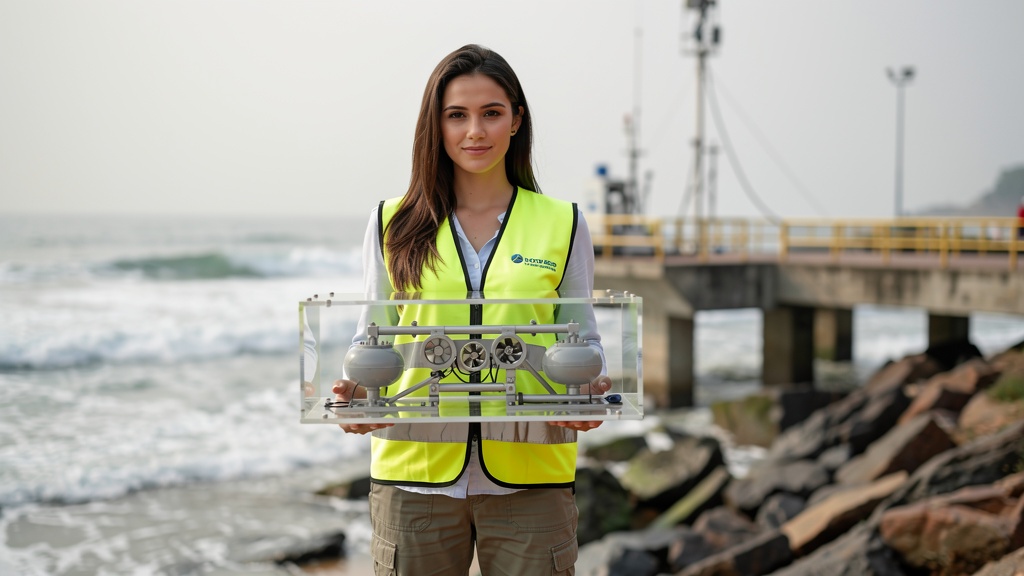
A marine scientist woman holds a clear scale model of an ocean wave energy converter ship at a coastal research station in India.
A scale model sits between policy and reality: most ocean energy work in India starts in the workshop before deployment at sea.
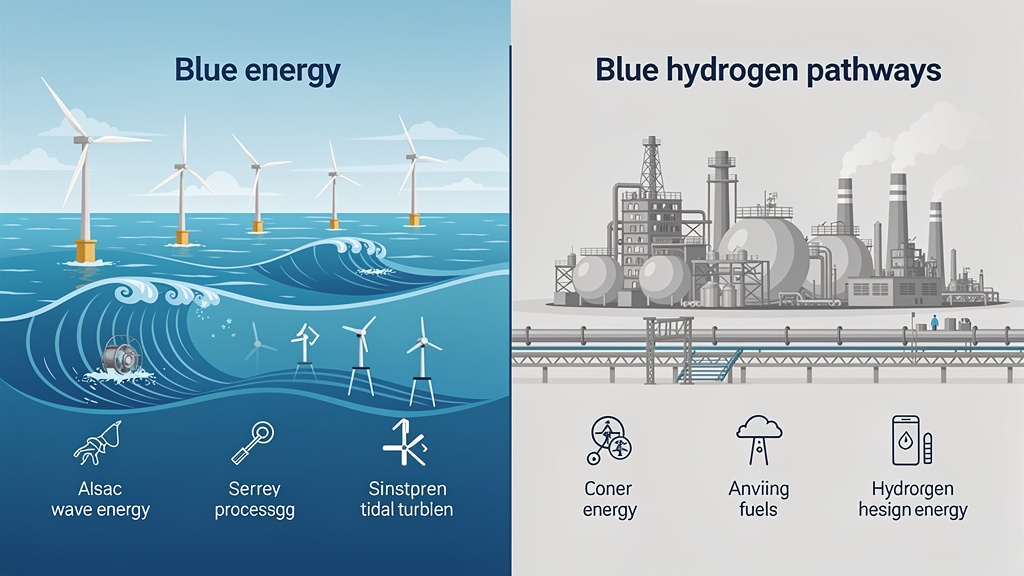
A split-screen illustration contrasting marine renewables on the left with industrial blue-hydrogen pathways on the right.
Same word, different fields — blue energy (renewable) is not blue hydrogen (fossil).
🌊

Wave energy

Power captured from ocean surface gravity waves. PI inside a buoy converts vertical motion into electricity. Higher energy density than wind per square metre of sea.

🌗

Tidal energy

Two main flavours: tidal barrage across bays and tidal stream in narrow channels. Strongest in the Gulf of Khambhat and the Sundarbans.

♨️

OTEC & LTTD

Exploits the temperature difference between warm surface water and cold deep water in tropical seas. Largest deployment funnel: islands needing clean water.

💧

Salinity-gradient energy

The classical academic sense of “blue energy”: PRO and RED using the chemical-potential difference between fresh river water and seawater.

🌀

Ocean currents

Slow, vast, persistent currents such as the Kuroshio or the monsoon drift. Lower instantaneous power, but very high capacity factor.

💨

Offshore wind & floating PV

Wind turbines and PV arrays at sea. India’s most-mature ocean energy, with national targets and lease areas.

Why a single combined atlas?

The “integrated” in INCOIS’s Integrated Ocean Energy Atlas

Most early ocean-energy atlases were form-specific: a wave energy atlas reported wave flux across grid cells; a tidal atlas reported tidal stream speeds. The innovation in the INCOIS 2024 atlas was to overlay all seven forms on a single 5 km grid, so that

  • Coastal-state planners can answer the question “what’s the best low-carbon option for my district?” without consulting four different atlases.
  • Hybrid-platform designers can identify cells where two or more forms are simultaneously strong — e.g. a place that is both windy and wavy — and design a single mooring that captures both.
  • Resource modellers can check consistency between forms using the same coastline boundary and modelling framework.

This is also why the headline figure — 9.2 lakh TWh — is reported as an integrated theoretical figure. The four-step ladder from resource → extractable → techno-economic → project-feasible is then applied across all forms consistently. See India’s potential for the full breakdown and methodological notes.

Reading guide

Reading the seven forms: what each section on this site covers

Each of the seven “blue energy” technologies has its own page on this site. The same five-section template is used, so you can compare them on equal terms.

1️⃣

Working principle

What physical phenomenon the device exploits, described without equations, and where in India that phenomenon is strongest.

2️⃣

Resource & form of potential

Numbers from the INCOIS atlas or peer-reviewed papers, with caveat on whether the figure is resource or techno-economic.

3️⃣

Projects & technology status

What has been demonstrated in India and globally, with technology readiness levels and pilots.

4️⃣

Costs & maturity

Capex ranges, operating constraints (corrosion, biofouling, grid), comparative cost-curve position.

5️⃣

Challenges & outlook

Environmental, social and regulatory questions, with the apparent outlook on a 1-, 5- and 15-year horizon.

How ocean and offshore renewables map onto India’s climate plans

India’s 500 GW non-fossil installed-capacity target by 2030 already includes offshore wind, fixed and floating. Other ocean forms are not yet named in that headline target, in part because baselines are still being built and in part because the technologies are less mature. Inclusion in a national target tends to lag a published atlas by 2–5 years.

“The 9.2 lakh TWh integrated theoretical potential is far larger than any plausible deployment. It is a resource envelope — it tells us there is energy there. It does not tell us whether we should build devices to capture it.”

That statement is a paraphrase of how INCOIS, NIOT, MNRE and academic reviewers in 2023–2024 framed the meaning of the atlas figure. The Integrated Ocean Energy Atlas is intentionally aspirational — a long-term resource envelope — and the techno-economic margins and project feasibility therefore do the real work of prioritisation.

Related frameworks

If you’re a researcher or student looking for foundational definitions, the resources page links to the INCOIS Atlas, NIOT technical reports, the IEA Ocean Energy Systems reports, and the IRENA renewable-energy statistics.

Glossary

Key terms at a glance

Quick glossary for the rest of the site
TermPlain-language meaning
EEZExclusive Economic Zone — the 200 nautical mile band where a coastal state has resource rights. India’s EEZ covers ~2.02 million km².
Resource potentialThe gross energy physically present in a sea area — usually the largest of the four figures and the most misleading.
Extractable potentialWhat a realistic device at realistic efficiency could intercept from the resource. Substantially smaller than resource potential.
Techno-economic potentialWhat is plausibly deployable at plausible cost and grid access — the most useful “deployment ceiling” for planners.
OTECOcean Thermal Energy Conversion — power from the temperature gradient between warm surface water and cold deep tropical water.
LTTDLow-Temperature Thermal Desalination — using the same gradient to make fresh water without electricity-intensive reverse osmosis.
PRO / REDPressure-Retarded Osmosis and Reverse Electrodialysis — the two main methods for capturing salinity-gradient (“osmotic”) energy.
Capacity factorThe fraction of nameplate output that a device actually delivers over a year — ocean renewables are typically 25–45%, OTEC and tidal can be higher.
BiofoulingBuild-up of marine organisms on submerged surfaces — a major operating-cost item for ocean devices.
MSP (Marine Spatial Planning)A planning process to allocate sea space between energy, fisheries, navigation, biodiversity and conservation uses.