Technology deep-dive

Wave energy in India

Wave energy captures power from ocean-surface gravity waves — the same waves seen rolling into Indian beaches. At the best of India’s wave corridors, this resource is so dense that a 1-metre wave-front 100 m wide carries roughly the kinetic energy that would be needed to power hundreds of homes for an hour. The challenge is converting that flux reliably, surviving the monsoon, and delivering electricity at competitive cost.

Working principle Vizhinjam OWC NIOT Pilot scale Monsoon sensitivity
How to read every ocean energy number on this site. Every statistic — wave flux in kW/m, “lakh TWh” envelope, Indian capacity figures — is presented at four levels: resource potential (gross energy physically present in a sea cell), extractable potential (what a real device can capture at realistic efficiency), techno-economic potential (what is plausibly deployable at plausible cost with grid access) and project feasibility (what survives site-specific engineering, environmental and social screening). The largest number is always the resource potential and is almost never what gets built. For any deployment-relevant figure, look at the techno-economic line. Wave in particular has the largest gap between resource (very big) and techno-economic (much smaller).

What wave energy actually is

Ocean surface waves are gravity waves — pressure gradients and orbital water motion restoring a flat sea. Their energy travels with the wave, not with the water itself — which is why a buoy a kilometre offshore can bob and convert energy without the deep ocean moving. Wave energy flux (per metre of crest length, kW/m) scales with the square of wave height and with wave period.

Devices are sometimes grouped by where they sit in the water column:

  • Surface zone — point absorbers, attenuators, oscillating water columns (OWC).
  • Mid-depth — some point absorbers, oscillating wave surge converters.
  • Surface, near-shore — overtopping devices, fixed OWCs built into breakwaters.
  • Submerged — Archimedes wave swing, submerged pressure-differential devices.

India’s piloting experience covers the surface zone and the fixed OWC: NIOT deployed a 150 kW oscillating water column pilot at the Vizhinjam breakwater near Thiruvananthapuram in the late 1990s, one of the earliest grid-connected OWC devices anywhere.
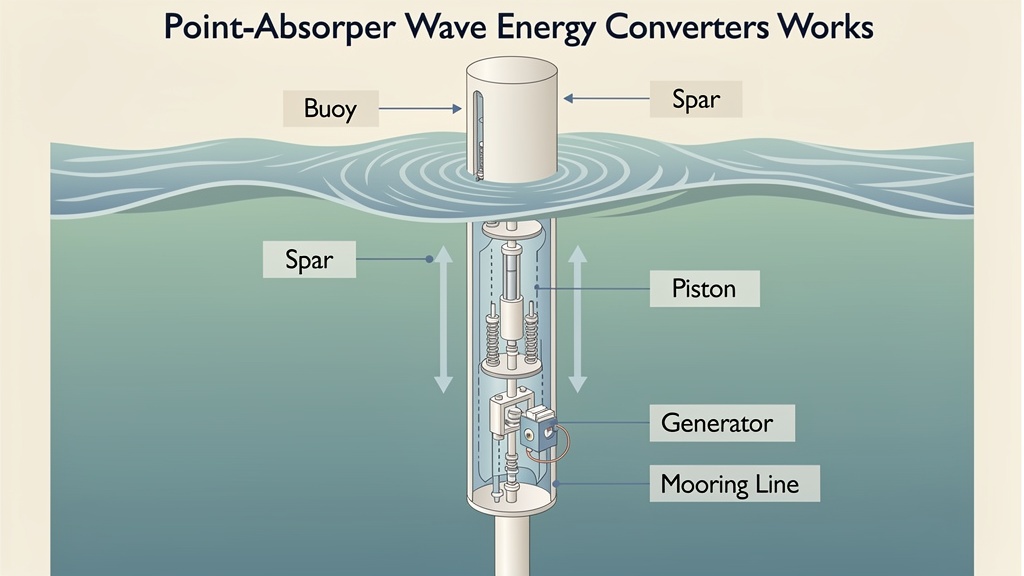
A clean educational diagram showing a point-absorber wave energy converter with the buoy floating, vertical motion driving a piston inside the spar.
Point absorber — a buoy harvests heave motion relative to a submerged spar.
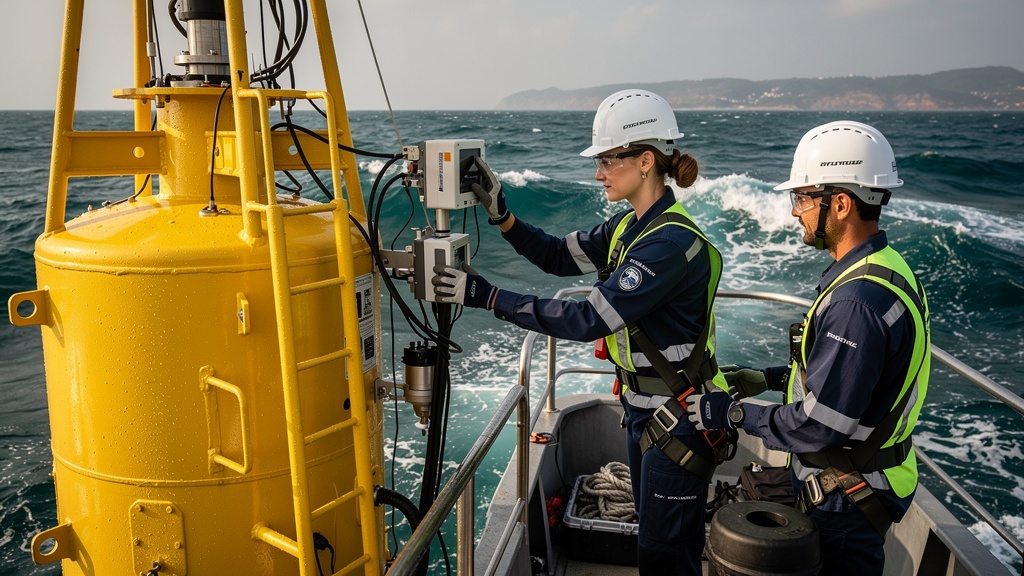
A marine engineering team servicing a wave energy buoy from a small boat on the open sea near India’s southern coast.
At-sea servicing — reliability depends on survivability and regular intervention.
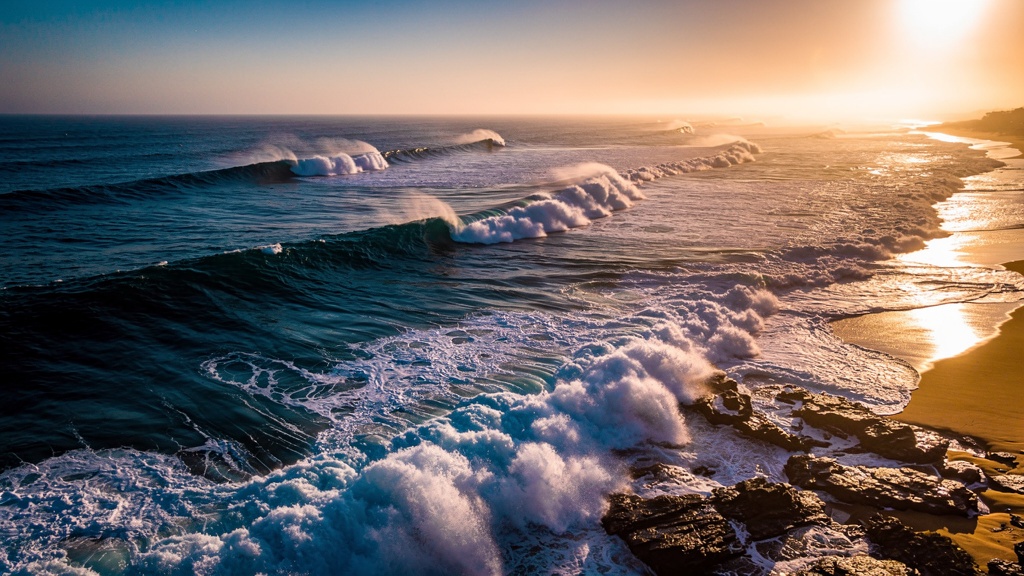
Aerial photograph of large rolling ocean waves breaking on the southern coast of India at golden hour.
Indian coastline — the same waves a device would harvest.
Device taxonomy

The five families of wave device you’ll see referenced

Different forms exploit different parts of wave motion and survive different extremes. Almost every credible Indian research programme has looked at all five before committing to one.

Point absorber

A buoy heaves against a fixed reference (a submerged spar) driving a linear generator or a hydraulic motor. Small footprint, modular, easy to deploy in arrays but wants a stable seabed and survives extreme waves by submerging parts that can survive storms.

〰️

Attenuator

Long, articulated floating segments aligned with the wave direction; the segments flex with passing waves and the relative motion drives hydraulic generators. Large footprint per device, well-suited to deep water further offshore.

🏗️

Oscillating water column (OWC)

A hollow chamber open below the water surface traps a column of air; waves compress it, driving a low-pressure turbine at the top. Generally sited near breakwaters or piers — the NIOT Vizhinjam pilot is the canonical Indian example.

⛰️

Overtopping

Waves run up a ramp into a reservoir above sea level; the reservoir drains through conventional low-head turbines. Bulky and near-shore, useful when a coastal reservoir design is already needed.

🤿

Submerged pressure-differential

Devices sit just below the surface and exploit pressure differential between wave crest and trough above the device. Invisible from shore, good in high-energy seas, but harder to maintain.

Where India has wave resource

INCOIS’s wave atlas shows that the south-west coast during the south-west monsoon (May–September), and the southern tip during both monsoons, carry India’s most consistent and densest wave flux. The Karwar–Mangalore–Kozhikode–Kochi–Alleppey–Quilon–Trivandrum coastline forms the country’s primary wave corridor, with mean annual resource flux in the 5–15 kW/m of crest band as a baseline figure for many of these cells.

Two important caveats:

  1. Monsoon concentration. Indian wave energy is strongly monsoon-loaded. Coastal cells with strong resource in June–August can have low resource in November–February. Whether that fits your grid or market determines whether the technology is usable at that site.
  2. Resource ≠ capacity factor. A device with nameplate 1 MW might deliver 25–35% capacity factor at a good Indian wave cell. The average power is several hundred kW; the peak is much higher and the device must be designed for it.

Cells of interest

  • Kochi–Alleppey–Quilon — strongest west-coast annual flux.
  • Kanniyakumari–Tuticorin — southern-Tamil-Nadu corner combining both monsoons.
  • Vizhinjam corridor — historically significant; NIOT site.
  • Mahabalipuram–Kakinada — east-coast segment with North-East monsoon loading.
Storm survival matters. A device in a good Indian cell will see tropical-cyclone-driven extremes that exceed 4× the average wave height. Engineers size for survival first, then for energy capture, which is why device designs look so rugged compared with solar PV racks.
Indian project history

NIOT, Vizhinjam and the national research arc

India’s wave-energy work has been coordinated primarily through the National Institute of Ocean Technology (NIOT), under MoES. The 1990s pilot programme deployed India’s most-cited early device; the 2010s programme focused on survival-at-sea and reliability; the current decade emphasises small, modular wave-powered devices (notably navigational buoys) and supporting OTEC, salinity-gradient and offshore-wind research.

  • 1990s — Vizhinjam OWC pilot
    150 kW oscillating-water-column wave energy pilot deployed at the Vizhinjam breakwater near Thiruvananthapuram. The device was grid-connected and generated at low service factor; lessons on monsoon survival, biofouling and breakwater integration shaped Indian wave-energy thinking for decades.
  • 2000s — Navigational buoy programme
    Wave-powered navigational buoys deployed for the Indian Coast Guard and port authorities. These are small but high-volume deployments, where the data on survivability, payload power and saltwater power-electronics are valuable.
  • 2010s — Reliability-and-survival programmes
    NIOT and academic partners (IIT Madras, IIT Kharagpur, NIT Karnataka and others) ran laboratory and sea-trial programmes focused on anchoring, power-take-off reliability and structural survival.
  • 2020s — Integrated Atlas & LTTD/OTEC orientation
    The INCOIS Integrated Ocean Energy Atlas shifts the framing from per-technology device testing to integrated resource assessment and hybrid platforms; OTEC and LTTD work absorbs much of the wave-team’s at-sea operational capability.

Source: NIOT annual and technical reports; INCOIS atlas v2024; projects & technology for the full historical and current list.

Status snapshot

Reality check: wave energy in India today

Wave energy — potential, status, friction points
AspectStatus as of 2024–2025
Resource potentialTens of GWh/yr at India’s identified hotspots. Resource envelope well-characterised.
Techno-economic potentialA fraction of resource; specific to sites with consistent year-round load, grid or island baseload replacement.
Deployed capacityNo commercial-scale grid-connected arrays yet. Pilot and buoy deployments only.
Domestic device pipelineModular buoy fabrication at small scale; offshore-wind supply chain indirectly supports several parts.
International contextGlobal wave remains at pre-commercial level; no LCOE has fallen below typical onshore wind levels without subsidy.
Strongest frictionCapex; biofouling; survival in tropical cyclones; grid connection beyond breakwater/port scale.

Costs and where the cost-curve sit

Indian wave energy is still in the late-pilot / early-pre-commercial stage. Capex ranges found in 2023–2024 NIOT and IEA-OES reports sit at roughly Rs 4–10 crore per installed MW for point-absorber-style devices in Indian sea-state — high relative to onshore wind (under Rs 7 crore/MW) and far from solar storage-augmented PV. Reducing capex to Rs 2–3 crore/MW is what global wave-energy roadmaps target around 2030, but the trajectory is uncertain.

The biggest cost items

  1. Mooring and foundation — roughly a third of installed cost. Mooring loads at Indian cells are large because of monsoon and tropical-cyclone extremes.
  2. Power take-off (PTO) — linear generators for point absorbers are still bespoke and expensive.
  3. Sub-sea cable & onshore substation — site-dependent, can dwarf capex of the device itself at remote sites.
  4. O&M and access — boats, weather windows, crew — make O&M expense a higher fraction than for onshore wind or solar.
Don’t compare apples to oranges. Generic “Rs X / kWh” figures for wave from international atlases rarely reflect Indian capex, monsoon extremes, or the absence of a domestic component supply chain. Always re-derive at the site level.

Challenges

Operational challenges that recur in Indian pilots:

  • Biofouling — tropical waters accelerate growth on submerged surfaces, raising maintenance needs and degrading performance.
  • Corrosion — splash zone and submerged steel without cathodic protection fails quickly.
  • Cyclones — Varanasi-class cyclones impose extreme-wave loadings that not all device designs are rated for.
  • Grid connection — beyond port-and-breakwater scale, sub-sea cable to grid adds cost and permitting time.
  • Permitting — combined CRZ, MoEFCC environmental, MoD defence and fisheries consultations are necessary.
  • Standards — IEC TC 114 international standards exist; Indian standards participation is ongoing.

Where wave energy in India makes sense first

If you’re a planner considering wave energy, the most defensible early cases in India are:

  1. Island baseload partnership with OTEC and floating PV — e.g. Lakshadweep and parts of A&N, where diesel is being displaced.
  2. Port-and-breakwater small arrays integrated with harbours — Vizhinjam, Cochin, New Mangalore, Paradip.
  3. Modular buoy arrays near aquaculture — supplying payload power to monitoring and processing equipment offshore.
  4. Hybrid platforms combining wave, offshore wind and floating PV — see hybrid systems.

The standalone utility-scale wave farm remains aspirational — but its sub-components — buoy, PTO, mooring, survival engineering — are useful for several adjacent use cases and are the current Indian moat.

FAQ

Wave energy questions

Can wave energy alone power a city?
Not today. Wave energy globally remains pre-commercial, and Indian resource is concentrated on a single coastline. Even in long-term roadmaps, wave is a contributor, not a baseload substitute — and Indian wave is meant to complement, not replace, offshore wind and solar.
What happens during a cyclone?
A well-engineered Indian wave device either rides out a cyclone at a survival mooring, or submerges itself below the worst wave action and resumes operation afterwards. The 1990s Vizhinjam OWC taught the local research community that breakwater sited devices face scour damage over multiple cyclone seasons.
Is wave energy expensive?
Yes — capex remains high relative to onshore renewables. As of 2024, the global cost-curve implies that wave will not reach cost parity with onshore solar-plus-storage before 2030 absent significant learning or policy intervention.
Where can I read the Vizhinjam case study?
NIOT technical reports, peer-reviewed retrospectives in Renewable & Sustainable Energy Reviews (multiple 2018–2024 reviews), and the projects & technology page on this site. Specific journal references are listed on resources.