Pros & cons, fairly stated

Blue energy: benefits & challenges in India

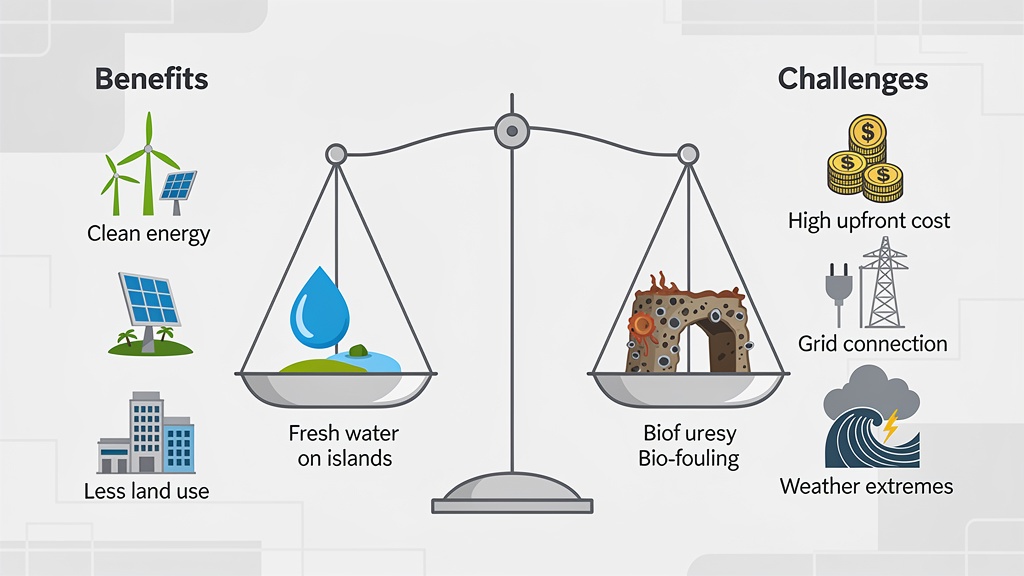
Marine renewable energy is not a free lunch. It cuts diesel imports and lights up islands, but the kilowatt-hour is still more expensive than onshore solar in most of India — and the engineering survives monsoons, salt, biofouling and fishing pressure only when those realities are budgeted for. This page lays out both sides, in equal weight, so the case can be judged on facts.

Energy security Island water & power Land-sparing Capex & LCOE Durability Ecosystem effects Social acceptance
How to read every ocean energy number on this site. Every statistic — the 9.2 lakh TWh headline, every per-form estimate, every pilot-plant capacity — is presented at four levels: resource potential (gross energy physically present in a sea cell), extractable potential (what a real device can capture at realistic efficiency), techno-economic potential (what is plausibly deployable at plausible cost with grid access) and project feasibility (what survives site-specific engineering, environmental and social screening). The largest number is always the resource potential. For any deployment-relevant figure, look at the techno-economic line. The benefit (and challenge) numbers cited below come from the lower three rungs of that ladder — they are estimates of what is actually deployable, not what the ocean contains.

Why the question matters in India

India imports roughly 85% of its crude oil and about half of its natural gas. Every diesel generator running on an island is a small but real claim on those imports. The country has 7,500 km of coastline, 1,382 inhabited islands, a 200-nautical-mile Exclusive Economic Zone that contains a measurable share of blue-energy resource, and four large megacities that sit within a metre or two of present sea level. So when a marine technology promises to displace diesel at remote sites or desalinate water at island scale, the question is not whether the resource exists — it does — but whether the device, the supply chain, the cost and the social agreement can stack up at scale on Indian terms.
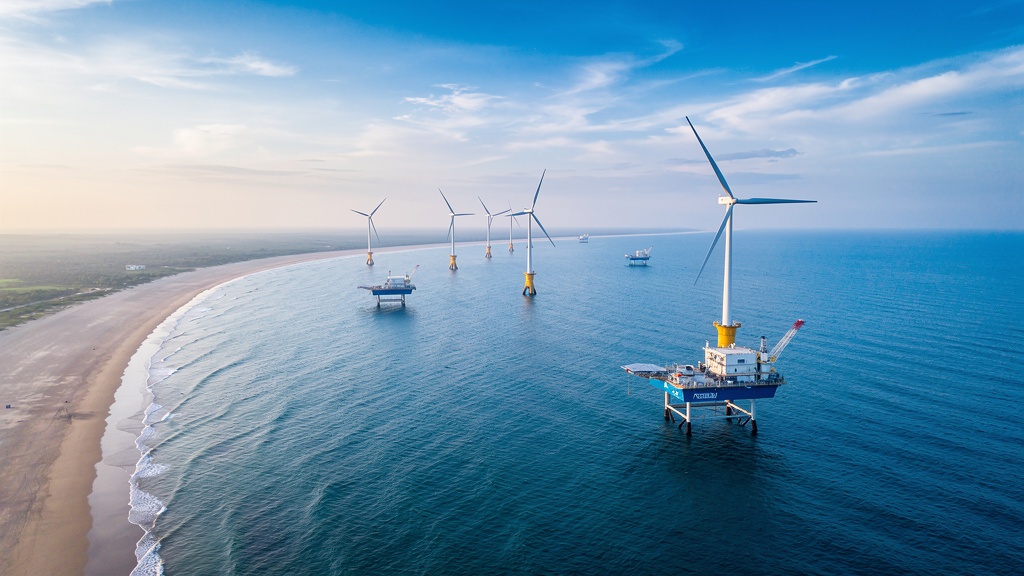
A pristine Indian coastline at low light, calm water lapping against pale sand, with no diesel plumes or visible pollution, evoking the clean-air dividend of marine renewables.
Clean coastline — the air-quality co-benefit that comes from displacing diesel at island and coastal sites.
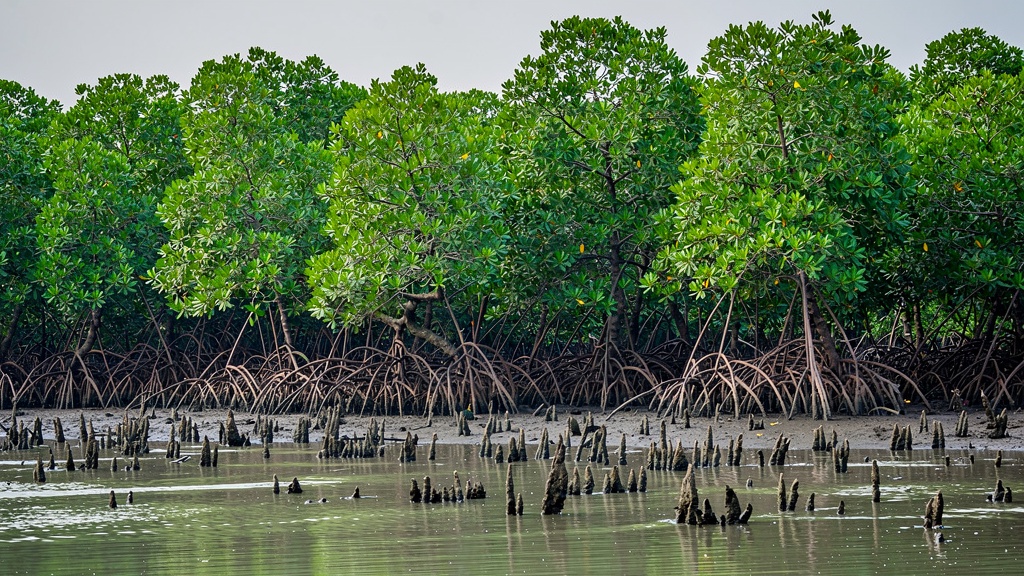
A dense Indian mangrove forest at the edge of a tidal creek where a discreet monitoring sensor sits at the water line, showing where blue energy and mangrove conservation must be co-designed.
Mangroves — the ecosystem standard that any tidal or salinity-gradient project on India’s coast must clear.
An open-ocean platform at scale rendered against the horizon, conveying the engineering ambition marine renewables need to reach for cost-parity.
Scale — the path from pilot to gigawatt depends on serial-fabrication, not one-off builds.
Benefits, in five clusters

What blue energy actually does well for India

The benefit case rests on five points: physical energy security, island-scale water and power, land sparing, climate accounting, and industrial spillover. Each is real, each has limits.

Reduced diesel dependence at remote sites

Every diesel-fired desalination plant on a Lakshadweep island has to be replenished by coastal tanker, often through rough monsoon seas. Replacing part of that duty with a local ocean-energy source tightens the security of supply, lowers the barge trip count and reduces the chance of an energy-and-water crisis after a cyclone. The aggregate saving is small in tonnage of national imports, but it is large in reliability for the affected community.

Island-scale water and power together

Ocean Thermal Energy Conversion combined with Low-Temperature Thermal Desalination, deployed at Kavaratti, Agatti and Minicoy, produces roughly 1.5 lakh litres of fresh water per day per 1 MW of OTEC duty, alongside 100–1000 kW of usable electricity. That pairing — water and kilowatt — is the operational signature of blue energy for tropical islands. No other renewable class routinely delivers both.

Land-sparing and dual-use

India’s land-use pressure on the 7,500 km coastline is severe. Marine renewables — particularly floating PV on inland reservoirs, offshore wind on leased seabed, and offshore floating hybrid platforms — produce electricity without claiming cropland, forest land, or salt-pan land. Floating PV has a second non-energy benefit: reduced reservoir evaporation, which in semi-arid states can mean months of additional water availability.

Climate and air-quality accounting

Blue-energy devices generate electricity close to where load is needed (coastal cities, ports, islands), reducing transmission losses and easing congestion on inter-state corridors. They displace fossil combustion, so the avoided SO₂, NOx, particulate and CO₂ accounting is comparable to any other zero-fuel source. They also provide predictable baseload-like output: tides are clock-accurate; OTEC is continuous while the thermal gradient exists.

Industrial and skill spillover

Building an OTEC plant, a multi-megawatt offshore wind foundation, or a salinity-gradient membrane pilot trains a domestic supply chain in fabrication, anti-corrosion engineering, marine-grade electrical systems and submarine cable jointing — all of which have defence, shipping and oil-and-gas dual uses. The spillover is a benefit even when the project itself is marginal on cost.

Predictability of resource

Wave, tidal and oceanic-thermal resources are highly predictable days to weeks in advance. That predictability is monetisable: it adds capacity value to the grid, supports storage dispatch planning and reduces the operating reserve that must be held for variable renewables. Tidal stream in particular resembles solar-and-wind on a clock-accurate cycle that can be forecast for the next 18 hours with metre-level precision.

The benefit case in numbers

Quantified upside, with the lower-rung figures

The numbers below are deployment-relevant (techno-economic or project-feasibility rung), not raw resource. They are the right shape for a policy debate; treat the upper-end of every range as an optimistic case.

85% Share of crude-oil imports India can displace partly at island scale by ocean-energy-and-desalination pairing. Figure is the lower-bound national exposure, not an ocean-energy-only number.
~1.5 LLPD/MW Fresh-water output of NIOT-style LTTD paired plants at Indian tropical-island conditions. Real operating figures from Kavaratti–Agatti track the public range of 1.0–1.5 lakh litres per day per MW of thermal duty.
30–45% Capacity factor contribution from blue-energy hybrids when paired with a renewable that fills the calm-season gap, based on Indian pilot hybrid-platform discussions.
~5–7% Order-of-magnitude reservoir evaporation reduction reported for inland floating PV pilots in Indian conditions, contributing to water availability rather than only electricity.
Challenges, in eight clusters

What blue energy has to win against

Each benefit above has a constraint that engineers, regulators and communities must address before the project can be counted. Honest assessment rather than cheerleading is the only path to scalable deployment.

1. Capital cost and LCOE

Most marine renewable devices cost more per kilowatt installed than onshore solar or onshore wind in 2024–25 terms. The LCOE gap closes slowly as serial fabrication, larger rotors, and longer operating hours drive amortisation downward, but the gap exists today. New capacity tenders in India still prefer solar and onshore wind on cost alone, even where ocean energy would be the more reliable resource in monsoon season.

2. Durability in monsoons and cyclones

The Bay of Bengal, the Arabian Sea and the south-west monsoon corridor produce wave heights, currents and wind speeds that routinely exceed the 50-year design envelope assumed for first-generation marine devices. Salt, swell and storm surge reduce service life. Coastal plants in low-lying deltaic regions face additional compound-flood risk. Insurance premia for marine installations reflect this; financiers notice.

3. Biofouling, corrosion and marine growth

Tropical waters accelerate biofouling — barnacle, mussel and algal growth on submerged structures — and corrosion of any metal that is not correctly specified. OTEC cold-water pipes are particularly vulnerable because their entire working surface is submerged for decades. Maintenance access in cyclone season is non-existent; preventive maintenance windows are narrow and expensive.

4. Capacity factor and grid integration

A single-source marine device (e.g., a standalone tidal barrage) delivers output at fixed times of day. Without storage, transmission to load centre, or hybrid pairing, the dispatch value falls. Salinity-gradient plants have a particular constraint: their output is governed by the volume of mixed brine-and-freshwater flow processed, which depends on rainfall upstream as much as on tidal exchange.

5. Ecosystem and habitat effects

Tidal barrages change siltation patterns and benthic ecology; offshore wind foundations introduce collision risk for migratory seabirds and bats; salinity-gradient plants discharge concentrated brine into estuarine food chains; OTEC discharge may carry nutrient flux that perturbs local upwelling patterns. Each effect is site-specific; field monitoring (not modelled prediction) is what counts in the EIA process.

6. Visual amenity and underwater noise

Offshore wind farms have a horizontal scale measured in tens of square kilometres. Wave and tidal arrays add machinery at or near the surface. Coastal communities with tourism economies (Goa, parts of Kerala, the Konkan, the Andamans) can find the visual envelope unacceptable. Underwater radiated noise from turbines is below seismic concern for most sites, but cumulative effects on resident cetaceans are an open question.

7. Social acceptance and fishing livelihoods

India’s small-scale fishing fleet operates from nearly every coastal district. The footprint of a marine renewable project — the reserve zone, the cable corridor, the construction exclusion — directly conflicts with artisanal fishing grounds. Compensation, alternate livelihood support, and co-design with the fishing panchayat are not optional add-ons; they determine whether the project survives the social-licence phase.

8. Permitting and seabed-rights clarity

India’s offshore leasing regime for renewable energy is young. The MoEFCC environmental-clearance pathway, the MEA defence-clearance overlay, the MoPSW shipping-route buffer, and the state maritime-board consenting each carry their own procedure. Project developers report that consenting time, not engineering time, is the binding delay.

Challenge severity at a glance

Where each form hurts most

The eight clusters above weigh differently on each blue-energy form. The same challenge can be benign for one technology and disqualifying for another.

Challenge cluster Wave Tidal OTEC / LTTD Salinity Offshore wind / FPV Currents
Capex / LCOE gap vs solar-wind High High High Very high Medium (closing) High
Monsoon / cyclone durability High Medium Medium Low High Medium
Biofouling and corrosion High High Very high (cold-water pipe) Medium (membrane) Medium High
Capacity factor alone Medium Low (clock-accurate) Low (continuous) Medium (rainfall-dependent) Medium–High Medium
Ecosystem / habitat effect Medium High (siltation) Medium (nutrient flux) High (brine) Medium (collision risk) Medium
Visual amenity Medium High (barrage) Low Low High (offshore wind) Low (subsurface)
Fishing-livelihood conflict Medium High Low–Medium High (estuary) Medium Medium
Permitting / seabed rights Medium High Medium Medium Medium (improving) Medium
How to read this table. “High” means the challenge routinely disqualifies or significantly delays a project in current Indian regulatory and financial conditions. “Low” means the constraint is well understood and operationally manageable at present, though not zero. The categories are not absolute — Salinity Gradient Power in the Sundarbans and tidal-barrage options on the Gulf of Kutch deserve a project-by-project treatment rather than this broad rating.
Cost reality

Where the LCOE band actually sits

Claiming that blue energy is “getting cheaper” is true but unhelpful without a working range. The figures below are the techno-economic-rung LCOE band, in 2024 INR, for a deployment-relevant scale (single-digit MW pilot at minimum, multi-MW for floating PV), expressed per unit of electricity delivered. They exclude the value of desalinated water, which is the dominant metric for island LTTD and OTEC.

Form Indicative Indian LCOE (2024 INR / kWh) Basis (deployment-relevant)
Onshore solar PV (for reference) ₹2.5 – 3.5 Utility-scale tender outcomes, 2022–2024.
Onshore wind (for reference) ₹3.0 – 4.0 SECI tender outcomes, 2022–2024.
Floating PV (inland reservoir, India) ₹3.5 – 5.5 SECI / state tenders, 2022–2024, pilot scale.
Offshore wind (fixed-bottom, Gujarat / TN pilots) ₹5.5 – 8.5 Pre-construction projections, first 4 GW pipeline.
Tidal stream (Khambhat-class pilot) ₹12 – 22 Single-digit-MW feasibility extrapolations.
Wave energy (Indian R&D pilot class) ₹15 – 30 One-off demonstrator LCOE; serial-fabrication projection lower, but not yet achieved in India.
OTEC + LTTD (Lakshadweep) ₹18 – 40 per kWh, with desalinated water at ₹30 – 80 per kL Operating record at Kavaratti / Agatti / Minicoy, including water co-product valuation.
Salinity gradient (PRO / RED, India pilot class) ₹20 – 40 Lab-to-bench scale only; multi-kW pilots not yet operational in India.

LCOE ranges above are deployment-relevant; they exclude the green-premium adjustment and the social-cost-of-carbon adjustment. They are not forecasts — they are working ranges from public tender outcomes, peer-reviewed piloting studies, and INCOIS / NIOT / SECI reporting. Where the upper end of a range is taken from one-off demonstrator projects, it is likely to fall as serial fabrication reduces capex.

Ecosystem and social licence

Two challenge clusters that decide project survival

Two challenges — ecosystem and social — are not pure engineering. They are decided in the EIA stage, in the panchayat consultation stage, and in the actual on-water operating record.

Ecosystem and habitat

Blue-energy deployment must clear an Environmental Impact Assessment under the EIA Notification 2006 and its amendments. For coastal and offshore renewable projects, the relevant issues include:

  • Benthic habitat: tidal barrage and salinity-gradient plants alter siltation and salinity in estuarine food chains. Bhitarkanika-style mangrove stretches and parts of the Sundarbans are sensitive particularly to salinity shifts of more than 2–3 PSU, but the marginal scale of most pilots keeps the effect localised.
  • Avian collision risk: offshore wind farms lie along the East Asian–Australasian Flyway, which is one of the world’s busiest migratory routes. The Gujarat and Tamil Nadu lease blocks partly overlap with shorebird stopover sites. Site-level bird survey data is the binding input.
  • Cetacean noise: pile-driving during offshore wind foundation installation produces broadband underwater noise; operational turbine noise is much lower but cumulative. The Arabian Sea humpback, the coastal Irrawaddy dolphin of the Sundarbans and the Ganges river dolphin all require acoustic-impact screening for nearby projects.
  • Brine and nutrient flux: salinity-gradient plants discharge concentrated brine; OTEC plant discharge carries upwelled nutrients. Both must be modelled at the receiving water body, not at the plant boundary.
  • Cumulative effects: a stretch of coast with several small projects collides less than a single multi-gigawatt one, but cumulative effects across a leasing plan must also be modelled.

Social licence at coast and at sea

India’s fishing economy engages roughly 16 million people at last official count. The binding social question is not whether the project will compensate, but what the regime looks like in practice:

  • Fishing-panchayat consultation: required under the Coastal aquaculture and CRZ regimes; meaningfully conducted only where the panchayat is briefed with mapped fishing-ground data, not generic compensation summaries.
  • Reserve-zone loss: each turbine or platform needs a cable corridor and a safety reserve, in which fishing is restricted or excluded. The narrow strips matter cumulatively for small-scale fishers.
  • Tourist amenity: offshore wind at the visual envelope of the Konkan or Goa coastline will be contested; OTEC plants at industrial-port sites are not.
  • Cultural heritage: certain fishing communities mark landing sites, navigation beacons and seasonal passages; an offshore lease that disrupts a navigation line is more than an economic matter.
  • Procedural justice: communities whose livelihoods are most exposed must be briefed on the EIA in language they use professionally, which in India is often not English and not Hindi.
Honest tally

What it adds up to

Read across the five benefits and eight challenges above, the case for marine renewable energy in India is genuine but conditional. It is not the cheapest decarbonisation tool on offer in 2024–25 — that remains solar PV. It is, however, the right tool for a specific set of use cases: islands where diesel is the only alternative, ports where OTEC’s combined water-and-power service is the unique fit, and coastal stretches where land availability is the binding constraint. And the case will strengthen as the engineering curve closes in on serial-fabricated OTEC cold-water pipes, larger offshore wind rotors and membrane lifetimes for salinity-gradient plants.

Where blue energy wins today

Island water and power. Coastal desalination at sites where reverse-osmosis electricity cost is the binding constraint. Inland floating PV on reservoirs where land is the binding constraint. Co-located hybrid platforms with offshore wind where transmission to load centre is solved.

Where it is not yet ready

Tidal and wave deployment for bulk grid electricity at multi-MW scale, except as a demonstrator. Salinity-gradient at any scale above single-digit kW bench pilot in India. Open-ocean deep-water OTEC at full resource-potential scale — the cold-water pipe is the open engineering question.

Where the case can strengthen

Through serial fabrication rather than one-off builds. Through a domestic supply chain for cold-water pipes, membranes, marine-grade power take-offs and anti-fouling coatings. Through a clarified leasing and consenting regime. Through co-design with the fishing panchayat from the first scoping meeting.

Frequently asked

Questions about the case, answered

Can blue energy realistically replace diesel on Lakshadweep?

Partly, yes — and that is the right framing. LTTD already supplies a share of fresh water at Kavaratti, Agatti and Minicoy; OTEC and hybrid pairing can extend that share, but the islands’ peak demand and seasonal tourism load still exceed what is achievable from LTTD-scale ocean thermal alone. The honest target is a multi-source mix: OTEC-LTTD plus rooftop solar plus storage plus a smaller standby diesel tranche, sized for emergencies rather than daily duty.

Is offshore wind genuinely cheaper than it was five years ago?

Yes, materially so in India’s pre-construction pipeline. Larger rotors (14 MW+), higher-capacity-factor sites on the Gujarat and Tamil Nadu coast, and serial fabrication of monopile foundations have moved the techno-economic-rung LCOE into the ₹5.5–8.5 per kWh band, down from early pilot projections of ₹10+. The cost path looks similar to onshore wind’s between 2010 and 2020, though the Indian pipeline is still being built out.

Why is wave energy so much more expensive than wind in India?

Three reasons. First, no Indian wave-energy device has yet reached commercial serial production — each one is still a one-off or a small batch. Second, the capture cross-section of a wave device per unit rated capacity is smaller than the swept area of a wind rotor, so it harvests less energy per square metre of hardware. Third, the offshore maintenance regime for a wave device is harsher than for an offshore wind turbine of the same rating. India’s wave-energy pilots are still too few to amortise these costs at scale.

Does blue energy harm marine ecosystems?

It can — it depends entirely on the device, the site, and the operating regime. Tidal barrages alter siltation patterns at large scale; offshore wind has documented avian collision risk; salinity-gradient plants discharge concentrated brine; OTEC discharge carries nutrients downstream. Each effect is size- and site-specific. Most Indian pilots are small enough for the effect to be locally measurable, though cumulative effects across a leasing plan still require modelling.

Will blue energy reach cost parity with solar PV?

Possibly, eventually — but not on the same trajectory. Solar PV learning-curve cost decline has been sustained over four decades; marine renewables are starting from a much smaller production base. Cost parity is more plausible for offshore wind (which is already inside the same cost band as India’s mid-cycle onshore wind) than for tidal, wave, OTEC or salinity-gradient individually, all of which need the serial-fabrication curve to bend first.

What is the single biggest barrier to scaling blue energy in India?

The single most consistent answer from Indian developers, IITs and NIOT is serial fabrication rather than resource size, even before consenting or LCOE. The country can build one OTEC plant, one tidal barrage, one wave-energy demonstrator; the learning curve that drives cost down only activates when the second, the fifth and the fifteenth device are built. Until then, each new project is still a one-off engineering exercise.

Are these benefits for India specifically, or globally?

The clusters above are stated for India because the priorities differ from, say, Scotland or the US Pacific Northwest. India’s binding near-term problem is diesel at island sites and water scarcity at coastal communities; Scotland’s is bulk grid decarbonisation through predictable tidal stream; the US Pacific Northwest’s is wave-energy space-constrained grid load following. The challenges, especially biofouling in tropical water and cyclone-season survivability, are sharper for India than for higher-latitude analogues.

Read this alongside the data

The numbers above are working bands, not forecasts. For how the resource itself was estimated at the 9.2 lakh TWh level, see the India’s Potential page. For the policy instruments currently used to defray some of the LCOE gap above, see the Policy and Institutions page. For the rare cases where blue energy has actually been built, see the Projects and Technology page.