Resource assessment

India’s blue energy potential — the INCOIS Integrated Ocean Energy Atlas in plain English

India’s Exclusive Economic Zone holds an estimated theoretical ocean- and marine-renewable energy resource of roughly 9.2 lakh TWh per year — the combined envelope for wave, tidal, ocean current, OTEC and offshore wind. This page explains how the Integrated Ocean Energy Atlas is made, what the figure represents and what it does not, and where the country’s hotspots are on a state-by-state basis.

INCOIS 5 km grid EEZ Resource vs deployable Regional hotspots
~9.2 lakh TWh/yr
Integrated theoretical ocean-energy resource across India’s EEZ
Source: INCOIS, 2024 Integrated Ocean Energy Atlas
2.02 million km²
Area of India’s EEZ where ocean energy is inventoried
Source: MoEFCC
5 km grid
Spatial resolution of the integrated atlas — finer than legacy atlases for most forms
Source: INCOIS Atlas v2024
7 forms
Wave, tidal (barrage + stream), current, OTEC, salinity gradient, offshore wind, floating PV — combined
Source: INCOIS Atlas v2024
How to read every ocean energy number on this site. Every statistic — including the 9.2 lakh TWh integrated theoretical resource — is presented at four levels: resource potential (gross energy physically present in a sea cell), extractable potential (what a real device can capture at realistic efficiency), techno-economic potential (what is plausibly deployable at plausible cost with grid access) and project feasibility (what survives site-specific engineering, environmental and social screening). The largest number is always the resource potential and is almost never what gets built. For any deployment-relevant figure, look at the techno-economic line. The atlas itself uses the same four-step ladder internally — which is why we reapply it throughout this site rather than mixing terms casually.

How the Integrated Ocean Energy Atlas is built

The INCOIS Integrated Ocean Energy Atlas combines long-term reanalyses and satellite-derived bathymetry, validated against moored instrument arrays, on a 5 km × 5 km grid covering India’s EEZ out to the continental-shelf break and beyond. Each grid cell receives, for each ocean-renewable form, four figures: resource potential, extractable potential, techno-economic potential and a feasibility score combining bathymetry, distance-to-shore, metocean extremes and exclusion-zone overlays.

Per-form reanalysis families

  • Wave: spectral wave models (WaveWatch III family) reanalysed over 30+ years. Wave energy flux in kW/m of crest length is integrated along 5 km coast segments to produce cell-level annual energy.
  • Tidal stream: depth-averaged harmonic constituents (TPXO family). Stream speed cubed maps give cell power. Tidal barrage potential uses a separate bounded-basin analysis with the geometry of notable bays.
  • Ocean currents: HYCOM family reanalyses for the Indian Ocean at 0.08° resolution, downscaled to 5 km near the shelf.
  • OTEC: thermal profiles from World Ocean Atlas climatologies, validated against moored Argo and NIOT cruises. Cell ΔT evaluated for a 1000 m cold-water pipe.
  • Offshore wind: long-term wind reanalyses, downscaled to 5 km using WRF offshore runs, with associated extreme-wind statistics for design.
  • Salinity gradient: estuary-based inventories where authoritative river-discharge data and ocean salinity meet.
  • Floating PV: a derived layer based on bathymetry, sea-state, exclusion zones and wave exposure rather than a directly measured flux.

From resource to deployable

For every cell the atlas reports the four-step ladder. The headline 9.2 lakh TWh figure is the integrated theoretical resource — for each technology the atlas itself gives an extractable and a techno-economic number that is many times smaller. The atlas also flags cells that intersect with marine protected areas, major shipping lanes, and cable corridors so the techno-economic figure excludes those.
Why the atlas is open. It is intended as a national planning reference. State planners, developers and researchers are encouraged to interrogate the WebGIS and request finer site-specific studies where lease windows or detailed design needs demand them.
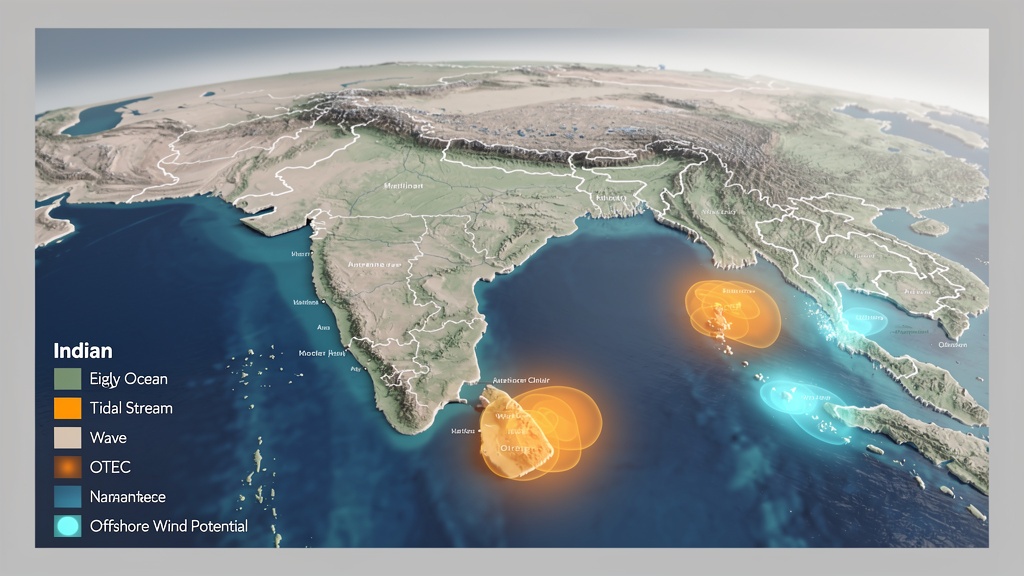
Stylised map of India surrounded by the Indian Ocean with glowing orbital energy-resource markers along the coasts and at island chains.
National overview of integrated theoretical potential — note the country’s coastline and island chain are where devices are deployed.
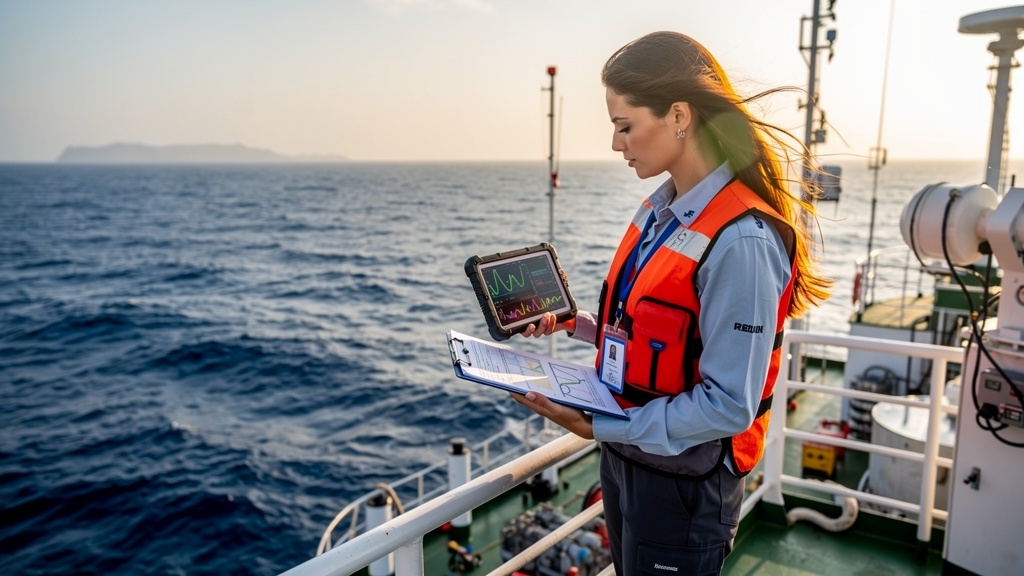
A marine scientist on the upper deck of an Indian oceanographic research vessel studying wave patterns near the west coast.
At-sea validation — the atlas is calibrated against moored data and dedicated research cruises.
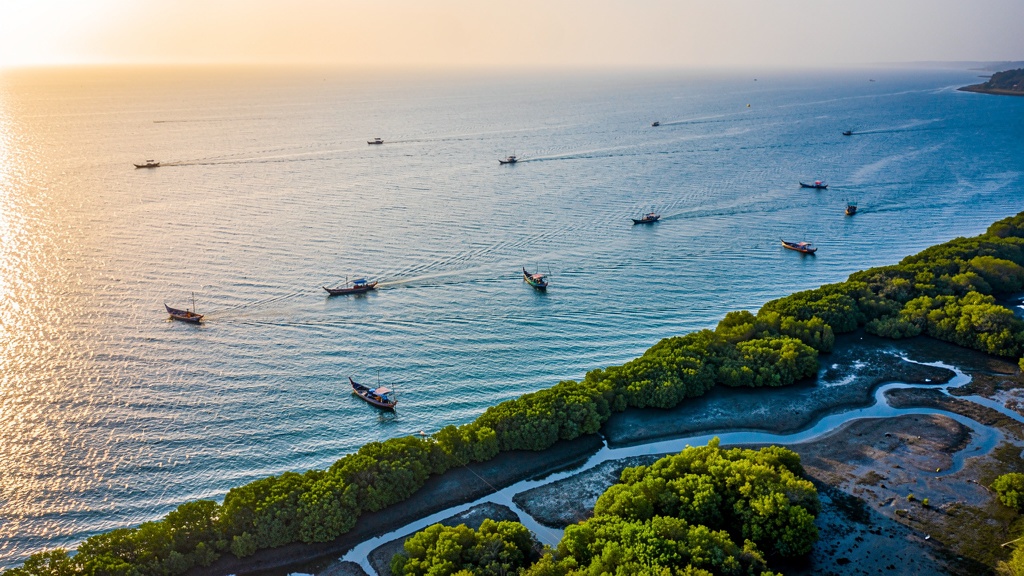
Aerial view of Gujarat’s Gulf of Khambhat at low tide — wide tidal flats and mangrove coastline.
Gujarat’s Gulf of Khambhat — India’s most-studied tidal resource area.
By form

What the atlas says about each technology

The Integrated Ocean Energy Atlas does not break out the share each form contributes to the headline 9.2 lakh TWh figure in the published summary — but the per-form atlases released alongside it are more specific. The numbers below are illustrative orders of magnitude derived from the methodological sections and from peer-reviewed regional studies. They update as INCOIS produces finer annual revisions.

Indicative integrated theoretical potential by technology
TechnologyOrder of theoretical potential (TWh/yr)Strongest Indian regionSee page
Offshore wind (including floating)Very large, dominating the integrated total when summed into lakhs of TWhTamil Nadu–Gujarat corridor; offshore of Mul Dwarka, Rameswaram, KanyakumariOffshore wind & floating PV
WaveTens of lakhs considered in aggregate; tens of GWh/yr at identified hotspotsSouth-west coast (Kerala, Karnataka), Mahabalipuram–Kakinada stretchWave
Tidal streamSingle-digit to low-tens of GWh/yr in identified bounded channelsGulf of Khambhat, Gulf of Kutch, Sundarbans channelsTidal
Tidal barrageBounded-basin storage figure; project-scale studies neededGulf of Khambhat, Gulf of KutchTidal
OTECSeveral GWh/yr per identified deep-water site, capped by cold-pipe lengthLakshadweep, Andaman & Nicobar, off KanyakumariOTEC
Ocean currentA few GWh/yr at identified cells, broad distributed resourceMonsoon drift, off Somali coast, Bay of Bengal south of Sri LankaCurrents
Salinity gradientLocal; estuary-scale GWh/yr figuresHooghly, Mahanadi–Brahmani, Godavari, Krishna, Mandovi–ZuariSalinity
Floating PVDistrict-scale, dependent on calm waters and transmissionBackwaters, sheltered bays, Omkareshwar reservoir cross-comparisonFloating PV

The Integrated Atlas does not publish a single-line per-form add-up; the entries above are order-of-magnitude ranges consistent with the methodology sections of the 2024 atlas and with peer-reviewed regional studies. The atlas’s own tables are the canonical source.

By region

State-by-state signals

Indo-specific coastal geography strongly influences which form dominates which state. The following guides the eye to the most-asked-about regions; each links to its detailed page where available.

Gujarat

The Gulf of Khambhat and the Gulf of Kutch hold India’s strongest tidal stream signatures. The state also leads India’s first fixed-bottom offshore wind lease. Salinity-gradient opportunities exist at the mouths of the Narmada, Tapi and Sabarmati.

TidalOffshore windSalinity

Tamil Nadu & Kerala

Southern tip of the peninsula is consistently the country’s strongest wave corridor; the Kanyakumari–Kanniyakumari coastline is an offshore-wind priority; Kerala’s coast has a meaningful but seasonal wave resource.

  • Wave energy — Vizhinjam, Kanyakumari.
  • Offshore wind — fixed-bottom leases (Phase-I 4 GW).
  • OTEC — deep water available close to shore.
WaveWindOTEC

Andhra Pradesh

Multiple large rivers meet the Bay of Bengal — Krishna, Godavari, Penna — creating the country’s strongest salinity-gradient signatures. The coast also has moderate tidal signatures and a wave resource.

SalinityTidalWind

West Bengal & Odisha

Sundarbans channels hold meaningful tidal stream signatures; the Hooghly estuary is a salinity-gradient site. Cyclone risk shapes engineering choices.

TidalSalinityCyclone

Lakshadweep

A coral atoll chain sitting on tropical water with deep cold bottom water close to shore — the strongest OTEC footprint in the country. LTTD plants already operating. Limited land area, diesel is the displaced fuel.

OTECLTTDIsland power

Andaman & Nicobar Islands

A chain of ~572 islands with deep tropical water bathymetry, strong OTEC potential, episodic typhoon exposure for wave and offshore wind, and significant tourism & fishing sensitivities.

OTECWaveCyclone

Goa & Karnataka

West-coast wave and offshore-wind resource is meaningful but interrupted by the monsoon; smaller tidal signatures; tourism sensitivities shape deployment.

WaveWindHybrid

Maharashtra

Long west-coast line — moderate wave and offshore-wind resource. Mumbai’s industrial demand provides a useful local sink; transmission-links matter.

WindWaveHybrid

Seasonality, monsoons and climate change

Indian ocean energy is strongly seasonal. The south-west monsoon amplifies wave and offshore-wind resource from roughly late May to September along the west coast. The north-east monsoon (Oct–Dec) reshuffles the resource to the south-east coast and the southern tip of the peninsula. OTEC and salinity-gradient resource are weakly seasonal — those forms match island baseload reasonably well because peaks and troughs are small.

What the climate literature says about change

Climate-modelling studies published in 2022–2024 indicate that global wave resource will shift poleward and intensify on average, but with strong regional heterogeneity around the Indian Ocean. The Integrated Ocean Energy Atlas flags that any long-term atlas will need re-tuning at roughly decadal cadence as physical-ocean models absorb new observations. Until then, plan deployment for current climate and revisit at the 10-year mark.

Watch for revisions. The 2024 Integrated Ocean Energy Atlas is a snapshot. INCOIS has signalled that grid resolution will move to 1 km in select high-priority zones (Gulf of Khambhat, Lakshadweep) over the coming years — and that the atlas will be recomputed with updated reanalyses at roughly 3–5 year intervals.

Why this site does not publish a single "deployable" number for the whole EEZ

Some sources quote a single deployable ocean-energy figure for India (commonly anywhere from a few thousand MW to a few tens of thousands of MW). They are usually summarising different things. We list the various numbers and their assumptions because the difference between resource potential and techno-economic potential is what determines whether a project is fundable, permitted and built.

Common questions on this page

Readers often ask:

  • Has INCOIS published a national ocean-energy roadmap? Not yet as a single document; several thematic working-group reports and Draft National Marine & Ocean Energy Policy consultations cover overlapping ground.
  • Is the atlas legally binding? No — it is a planning reference. Project-level statutory clearances (CRZ, environmental, defence, fisheries) remain with sectoral ministries.
  • Can a developer lease a cell out of the atlas? Yes — through the standard offshore-wind lease mechanism for wind, through state/UT tendering for island projects, and through MOEFCC / MoES coordination for novel technology pilots.

For policy and institutional context see policy & institutions; for project-level Indian experience see projects & technology.

Limits of the atlas

What the 5 km grid cannot do

The atlas is the best national-scale look India has. It is not a project design tool. Anything that depends on a specific 25 m × 25 m patch of seabed needs site investigation beyond the atlas.

🌐

5 × 5 km is still coarse

A 5 km grid averages out shoals, channels, reefs and tidal stream streaks. Don’t site a turbine without a finer-resolution local study.

🌊

Extreme metocean

The atlas publishes design-relevant extreme statistics at the cell level — for typhoon, cyclone and storm-surge windows a moored buoy campaign is the only way to ship-finish fabrication loads.

🐟

Ecological overlays

The atlas overlays Marine Protected Areas and shipping lanes — but doesn’t replace fisheries and benthos surveys for the specific licence area you intend.

🪨

Geotechnics

Seabed type matters enormously. The atlas provides a single bedrock-loose-sediment indicator at the cell level — but anchor design needs borehole and CPT data.

Grid

The atlas does not model grid headroom, sea-cable corridors or substation limits — those come from CTU/STU plans.

🪙

Cost curves

Cost-of-energy figures depend on site bankability, on procurement modality, and on capex trajectories — and move faster than the atlas itself.